


- Forum
- categories
- Markets, finance and governance
- Monitoring and evaluation (M&E), technical standards, certifications
- WASH data from the JMP
WASH data from the JMP
3269 views
- AjitSeshadri
-

- Marine Chief Engineer by profession (1971- present) and at present Faculty in Marine Engg. Deptt. Vels University, Chennai, India. Also proficient in giving Environmental solutions , Designation- Prof. Ajit Seshadri, Head- Environment, The Vigyan Vijay Foundation, NGO, New Delhi, INDIA , Consultant located at present at Chennai, India
Dear SuSANA Member. Dr. Freya
Very nicely done.
It is apt data gor practioner s to implement practices in varied sections.
Appreciating the apt compiling
Prof Ajit Seshadri
The Vigyan Vijay Foundation
Very nicely done.
It is apt data gor practioner s to implement practices in varied sections.
Appreciating the apt compiling
Prof Ajit Seshadri
The Vigyan Vijay Foundation
Prof. Ajit Seshadri, Faculty in Marine Engg. Deptt. Vels University, and
Head-Environment , VigyanVijay Foundation, Consultant (Water shed Mngmnt, WWT, WASH, others)Located at present at Chennai, India
Head-Environment , VigyanVijay Foundation, Consultant (Water shed Mngmnt, WWT, WASH, others)Located at present at Chennai, India
Please Log in to join the conversation.
You need to login to reply- Freya
-

- WASH Research Consultant ISF-UTS
Less- Posts: 10
- Karma: 1
- Likes received: 12
Hi Paresh
I agree that the WASH data portal is great and I often create new charts to look at different aspects of sanitation such as the type of sanitation facility or basis for safely managed, as well as comparing regions or income groups. The first graph is similar to the overarching ladder you showed. It includes rural on the left (2000, 2015, 2022 data) and urban on right. The estimate for safely managed sanitation in rural areas of India in 2022 was 57%.
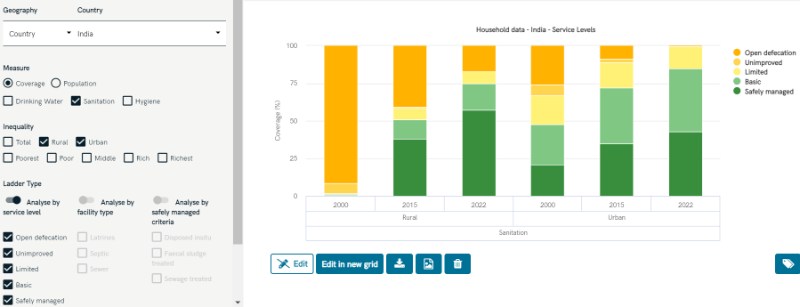
On the left options I then selected “Analysed by safely managed criteria” to understand the basis of that data and get the second graph that shows rural areas are safely managed due to “Disposed in situ”. This is defined as basic sanitation systems (improved not shared) that are either contained and not emptied, or contained emptied & disposed in a covered pit in-situ. From your experience does this sound accurate for rural sanitation in India?
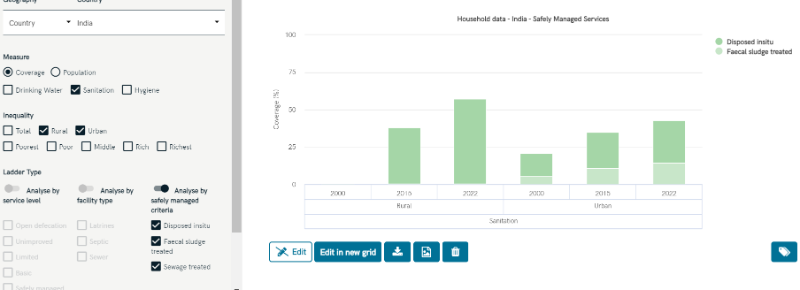
In urban areas safely managed sanitation is made up "disposed in-situ" and "faecal sludge treated off-site" (the bottom lighter green colour). It looks like fewer basic OSS in urban areas are classified as safely managed which I understand is due to the data indicating most of the population in urban areas use septic tanks, whereas rural areas were classified as using pit latrines. When no national data exists on containment, it is assumed that 100% of latrines are contained but only 50% of septic tanks are assumed to be contained due to common issues of overflow and outlet pipes to the surface environment. Also, looking at the country file, there are higher rates of emptied and disposed locally (drains/surface water/land) in urban areas than rural, which is not safely managed. Data on wastewater treatment also appears to be missing which may be why there is no safely managed wastewater. Although maybe there are other reasons that aren't evident from the online data, so just a note that these thoughts are just my personal understanding from what I can see online. I'd be interested to hear how you think this interpretation of the urban/rural differences align with what you see in field?
The other place I like to look is directly at the country file which shows all the data and basis of the estimates. All countries files are here: washdata.org/data/downloads#WLD From India’s file looking at the Data Summary tab, it seems that this data derives from the 2018 National Sample Survey from the NSO where they asked about emptying and disposal. The next round of updates will happen at the end of the year so hopefully if there are more recent national data to inform estimates these can be suggested during the WHO/UNICEF country consultations with NSO.
I’m currently supporting the JMP on the monitoring of safely managed on-site sanitation project and I am about to make some suggestions for updates to how this page shows OSS data (i.e. visualise containment and emptying findings). Let me know if you think there are other aspects that would be useful in the analysis tab or other suggestions to improve engagement in this part of the data portal.
Kind regards
Freya Mills
Sanitation consultant WHO, Joint Monitoring Programme
I agree that the WASH data portal is great and I often create new charts to look at different aspects of sanitation such as the type of sanitation facility or basis for safely managed, as well as comparing regions or income groups. The first graph is similar to the overarching ladder you showed. It includes rural on the left (2000, 2015, 2022 data) and urban on right. The estimate for safely managed sanitation in rural areas of India in 2022 was 57%.
On the left options I then selected “Analysed by safely managed criteria” to understand the basis of that data and get the second graph that shows rural areas are safely managed due to “Disposed in situ”. This is defined as basic sanitation systems (improved not shared) that are either contained and not emptied, or contained emptied & disposed in a covered pit in-situ. From your experience does this sound accurate for rural sanitation in India?
In urban areas safely managed sanitation is made up "disposed in-situ" and "faecal sludge treated off-site" (the bottom lighter green colour). It looks like fewer basic OSS in urban areas are classified as safely managed which I understand is due to the data indicating most of the population in urban areas use septic tanks, whereas rural areas were classified as using pit latrines. When no national data exists on containment, it is assumed that 100% of latrines are contained but only 50% of septic tanks are assumed to be contained due to common issues of overflow and outlet pipes to the surface environment. Also, looking at the country file, there are higher rates of emptied and disposed locally (drains/surface water/land) in urban areas than rural, which is not safely managed. Data on wastewater treatment also appears to be missing which may be why there is no safely managed wastewater. Although maybe there are other reasons that aren't evident from the online data, so just a note that these thoughts are just my personal understanding from what I can see online. I'd be interested to hear how you think this interpretation of the urban/rural differences align with what you see in field?
The other place I like to look is directly at the country file which shows all the data and basis of the estimates. All countries files are here: washdata.org/data/downloads#WLD From India’s file looking at the Data Summary tab, it seems that this data derives from the 2018 National Sample Survey from the NSO where they asked about emptying and disposal. The next round of updates will happen at the end of the year so hopefully if there are more recent national data to inform estimates these can be suggested during the WHO/UNICEF country consultations with NSO.
I’m currently supporting the JMP on the monitoring of safely managed on-site sanitation project and I am about to make some suggestions for updates to how this page shows OSS data (i.e. visualise containment and emptying findings). Let me know if you think there are other aspects that would be useful in the analysis tab or other suggestions to improve engagement in this part of the data portal.
Kind regards
Freya Mills
Sanitation consultant WHO, Joint Monitoring Programme
Attachments:
-
Indiasanit...2022.png
(Filesize: 55KB)
-
IndiaSmsan...2022.png
(Filesize: 48KB)
The following user(s) like this post: AjitSeshadri
Please Log in to join the conversation.
You need to login to reply- paresh
-
 Topic Author
- Moderator
- Budding WASH researcher, especially interested in governance, public policy, finance, politics and social justice. Architect, Urban & Regional planner by training, Ex. C-WAS, India.I am a patient person :)
Less- Posts: 383
- Karma: 7
- Likes received: 143
Hello All.
I'd like to bring to your attention a set of interactive database related to WASH from the Joint Monitoring Programme (JMP). The data is available for all countries, regions and the world for household level, for schools and healthcare facilities. The interface allows one to choose the sector, details, etc. to create graphs and trendlines. The data for the graph can also be downloaded.
Link: washdata.org/data
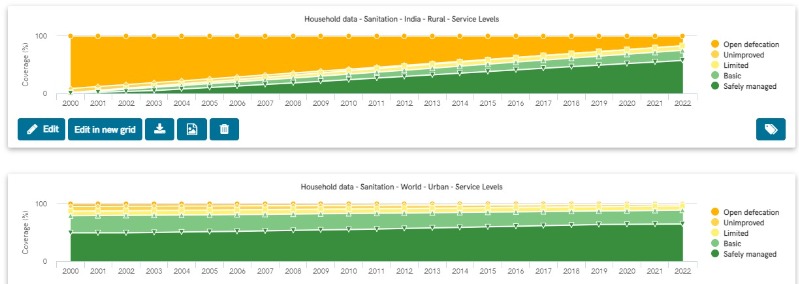
My somewhat biased view was that urban India has done well in increasing coverage of safely managed sanitation (increase of approx. 8 percentage points). I am pleasantly surprised that the rural areas have done even better (19 percetnage points) and by far. I am intrigued, and will try to figure out how that has happened. (Please respond if you know). Please see the dashboard here .
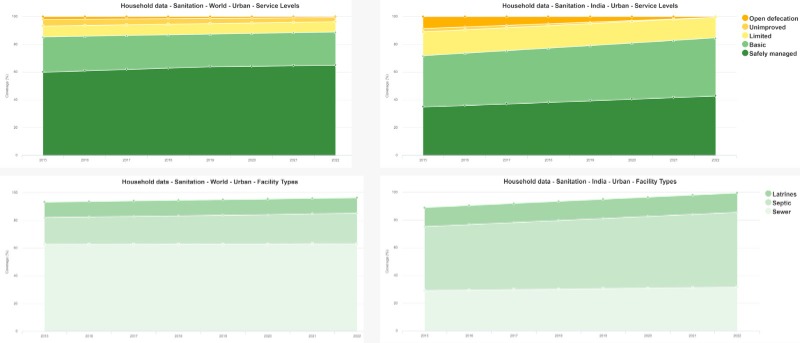
Another comparison of India with the World (only urban). The share of safely managed sanitation (SMS) in India has increased by nearly 8 percentage points compared to less than 5 percentage points at the global level. Further, much of the improvement is because of septic systems (~9 percentage points). It is true at the global scale as well. (see dashboard here )
Feel free to share how you used it and the insights you get.
Regards
paresh
I'd like to bring to your attention a set of interactive database related to WASH from the Joint Monitoring Programme (JMP). The data is available for all countries, regions and the world for household level, for schools and healthcare facilities. The interface allows one to choose the sector, details, etc. to create graphs and trendlines. The data for the graph can also be downloaded.
Link: washdata.org/data
My somewhat biased view was that urban India has done well in increasing coverage of safely managed sanitation (increase of approx. 8 percentage points). I am pleasantly surprised that the rural areas have done even better (19 percetnage points) and by far. I am intrigued, and will try to figure out how that has happened. (Please respond if you know). Please see the dashboard here .
Another comparison of India with the World (only urban). The share of safely managed sanitation (SMS) in India has increased by nearly 8 percentage points compared to less than 5 percentage points at the global level. Further, much of the improvement is because of septic systems (~9 percentage points). It is true at the global scale as well. (see dashboard here )
Feel free to share how you used it and the insights you get.
Regards
paresh
Paresh Chhajed-Picha
Moderator, SuSanA forum
Project Manager at ADCPS
Indian Institute of Technology - Bombay, India
Moderator, SuSanA forum
Project Manager at ADCPS
Indian Institute of Technology - Bombay, India
Attachments:
-
IndiaandWo...ban.jpeg
(Filesize: 31KB)
-
India_urba...ral.jpeg
(Filesize: 50KB)
The following user(s) like this post: cecile
Please Log in to join the conversation.
You need to login to reply
Share this thread:
- Forum
- categories
- Markets, finance and governance
- Monitoring and evaluation (M&E), technical standards, certifications
- WASH data from the JMP
Recently active users. Who else has been active?
Time to create page: 0.249 seconds