


- Forum
- categories
- Announcements and miscellaneous
- General announcements
- Announcements and discussions regarding SuSanA
- Information about the SuSanA website and social media channels
- A further result from the SuSanA partner mapping analysis
A further result from the SuSanA partner mapping analysis
8013 views
Hi Cecilia
Many thanks for these interesting stats!
I think these graphs are worth while to analyse together and be part of the baseline for a future SuSanA strategy.Obviously a lot of our work is envisaged to be support for sanitation policies and implementation in countries in development alias our concern and focus are the unserved (we find them in both low and middle income countries) and our desire is to see a fast scaling up of sustainable sanitation systems in these regions.So accortding to these graphs we are still heavily represented in high income countries thus it is my opinion that our focus must be on the regions and it would really great if we could find a viable structure and system for expanding our knowledge into low and middle income countries. How to do this? Here we need constructive innovative inputs from our members in these region. How can we do this? Should we descentralize the activities establish regionial platforms? It would be excellent if these graphs coudl be part of the discussion of a future SuSanA .
Madeleine Fogde
Program Director SIANI
Senior Project Manager at SEI
Tel +46 (0)8 6747652
Fax + 46 (0)8 6747020
Cell + 46 737078576
SKYPE mfogde71811
Kräftriket 2B
SE-10691 Stockholm
www.siani.se
www.ecosanres.org
www.sei-international.org
Program Director SIANI
Senior Project Manager at SEI
Tel +46 (0)8 6747652
Fax + 46 (0)8 6747020
Cell + 46 737078576
SKYPE mfogde71811
Kräftriket 2B
SE-10691 Stockholm
www.siani.se
www.ecosanres.org
www.sei-international.org
The following user(s) like this post: Elisabeth, tmsinnovation
Please Log in to join the conversation.
You need to login to reply
As part of the SuSanA partner mapping, an analysis was conducted where we checked how the countries of our partner organisations are doing in terms of economic development and access to improved sanitation. The analysis considered 189 partner organisations and 53 countries in total. Two SuSanA partner organisations had to regrettably be left out of this analysis because they are not in the economies list of World Bank (Tawain and Palestine).
Firstly, we grouped the countries of our partner organisations according to their income level. This analysis was made based on the World Bank classification for low-income country, lower-middle income country, middle-income country, high-income country OECD (Organisation for Economic Co-operation and Development) and high-income country non OECD. The classification is made based on the GNI (Gross National Income) per capita of July 2012.
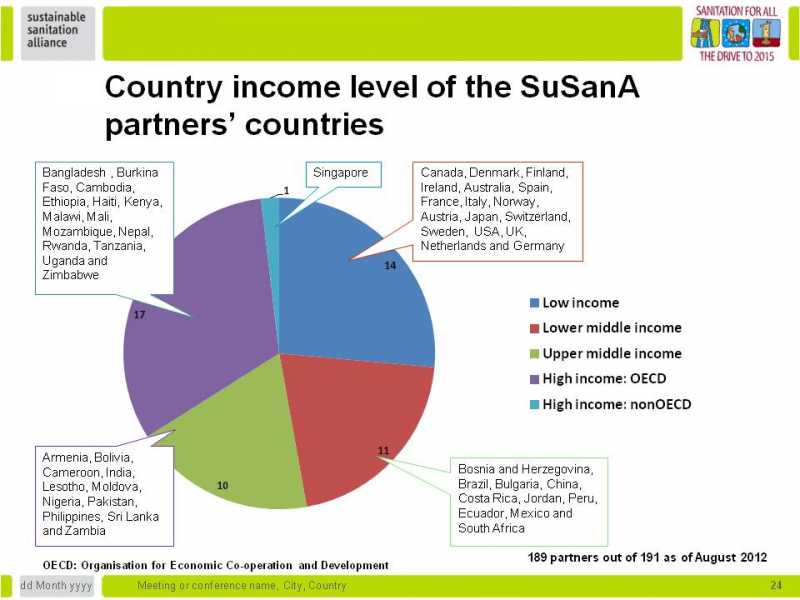
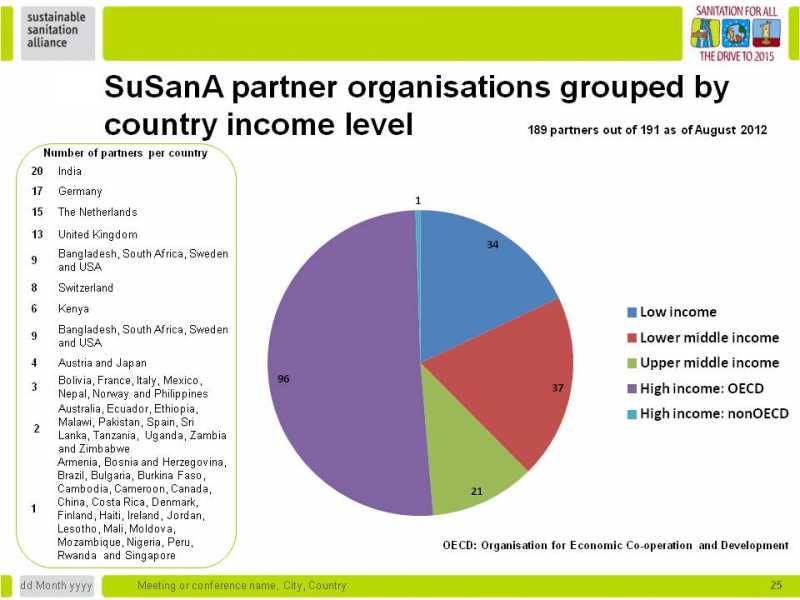
Secondly, we checked the partner organisations themselves. Interesting to notice is that when the countries are considered, regardless the number of partners in each country, it seems to be a more proportional share amongst the kind of economies. Nevertheless, when the partner organisations are considered, it is possible to see clearly that most of our partners are coming from the developed world.
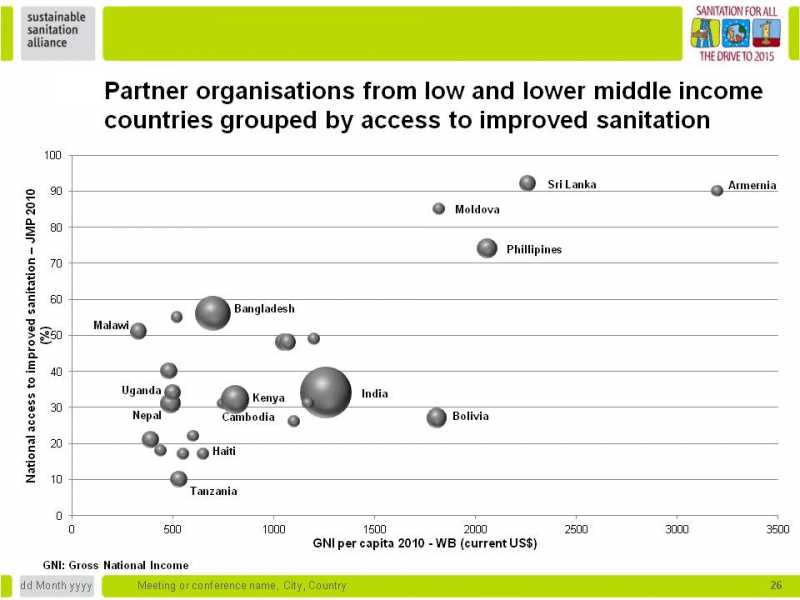
Thirdly, the analysis got a bit more complex and we brought together three variables: the GNI per capita, data provided by World Bank on the ‘x’ axis, national access to improved sanitation from JMP (Joint Monitoring Programme) on the ‘y’ axis, both from 2010, and the number of partners in each country, represented by the size of the bubble. The analysis was conducted with 25 countries considered low and lower middle income countries.
You can find the results of this analysis in PowerPoint format in the set of standard slides that introduce SuSanA, recently updated, available in our Library: A standard set of Powerpoint slides to explain SuSanA .
Any feedback on this analysis? Are you finding it useful?
Regards,
Cecilia
Firstly, we grouped the countries of our partner organisations according to their income level. This analysis was made based on the World Bank classification for low-income country, lower-middle income country, middle-income country, high-income country OECD (Organisation for Economic Co-operation and Development) and high-income country non OECD. The classification is made based on the GNI (Gross National Income) per capita of July 2012.
Secondly, we checked the partner organisations themselves. Interesting to notice is that when the countries are considered, regardless the number of partners in each country, it seems to be a more proportional share amongst the kind of economies. Nevertheless, when the partner organisations are considered, it is possible to see clearly that most of our partners are coming from the developed world.
Thirdly, the analysis got a bit more complex and we brought together three variables: the GNI per capita, data provided by World Bank on the ‘x’ axis, national access to improved sanitation from JMP (Joint Monitoring Programme) on the ‘y’ axis, both from 2010, and the number of partners in each country, represented by the size of the bubble. The analysis was conducted with 25 countries considered low and lower middle income countries.
You can find the results of this analysis in PowerPoint format in the set of standard slides that introduce SuSanA, recently updated, available in our Library: A standard set of Powerpoint slides to explain SuSanA .
Any feedback on this analysis? Are you finding it useful?
Regards,
Cecilia
Posted by a member of the SuSanA secretariat held by the GIZ Sector Program Water Policy – Innovations for Resilience
Located at Deutsche Gesellschaft für Internationale Zusammenarbeit (GIZ) GmbH, Bonn, Germany
Follow us on facebook: www.facebook.com/susana.org, linkedin: www.linkedin.com/company/sustainable-sanitation-alliance-susana.
Located at Deutsche Gesellschaft für Internationale Zusammenarbeit (GIZ) GmbH, Bonn, Germany
Follow us on facebook: www.facebook.com/susana.org, linkedin: www.linkedin.com/company/sustainable-sanitation-alliance-susana.
Attachments:
-
countryinc...ries.jpg
(Filesize: 46KB)
-
partnersgr...evel.jpg
(Filesize: 46KB)
-
partnersan...tion.jpg
(Filesize: 43KB)
The following user(s) like this post: Elisabeth, tmsinnovation, Doreen
Please Log in to join the conversation.
You need to login to reply
Share this thread:
- Forum
- categories
- Announcements and miscellaneous
- General announcements
- Announcements and discussions regarding SuSanA
- Information about the SuSanA website and social media channels
- A further result from the SuSanA partner mapping analysis
Recently active users. Who else has been active?
Time to create page: 0.164 seconds